What Is a Data Catalog?
Metadata, Discovery & the Role of Dataoma
By Dataoma Team • November 20, 2025 •
10 min read
Most teams don't struggle because they lack data. They struggle because they can't quickly find,
understand, or trust the data they already have.
Dashboards multiply, tables appear in every corner of the warehouse, and tribal knowledge spreads
across Slack threads and undocumented SQL. At some point, you need a dedicated way to organize
this
chaos so people can reliably answer questions without guesswork.
That's where a data catalog comes in, and where platforms like
Dataoma add an important twist by combining cataloging with automated
profiling,
documentation, and data quality testing directly on top of your data warehouse.
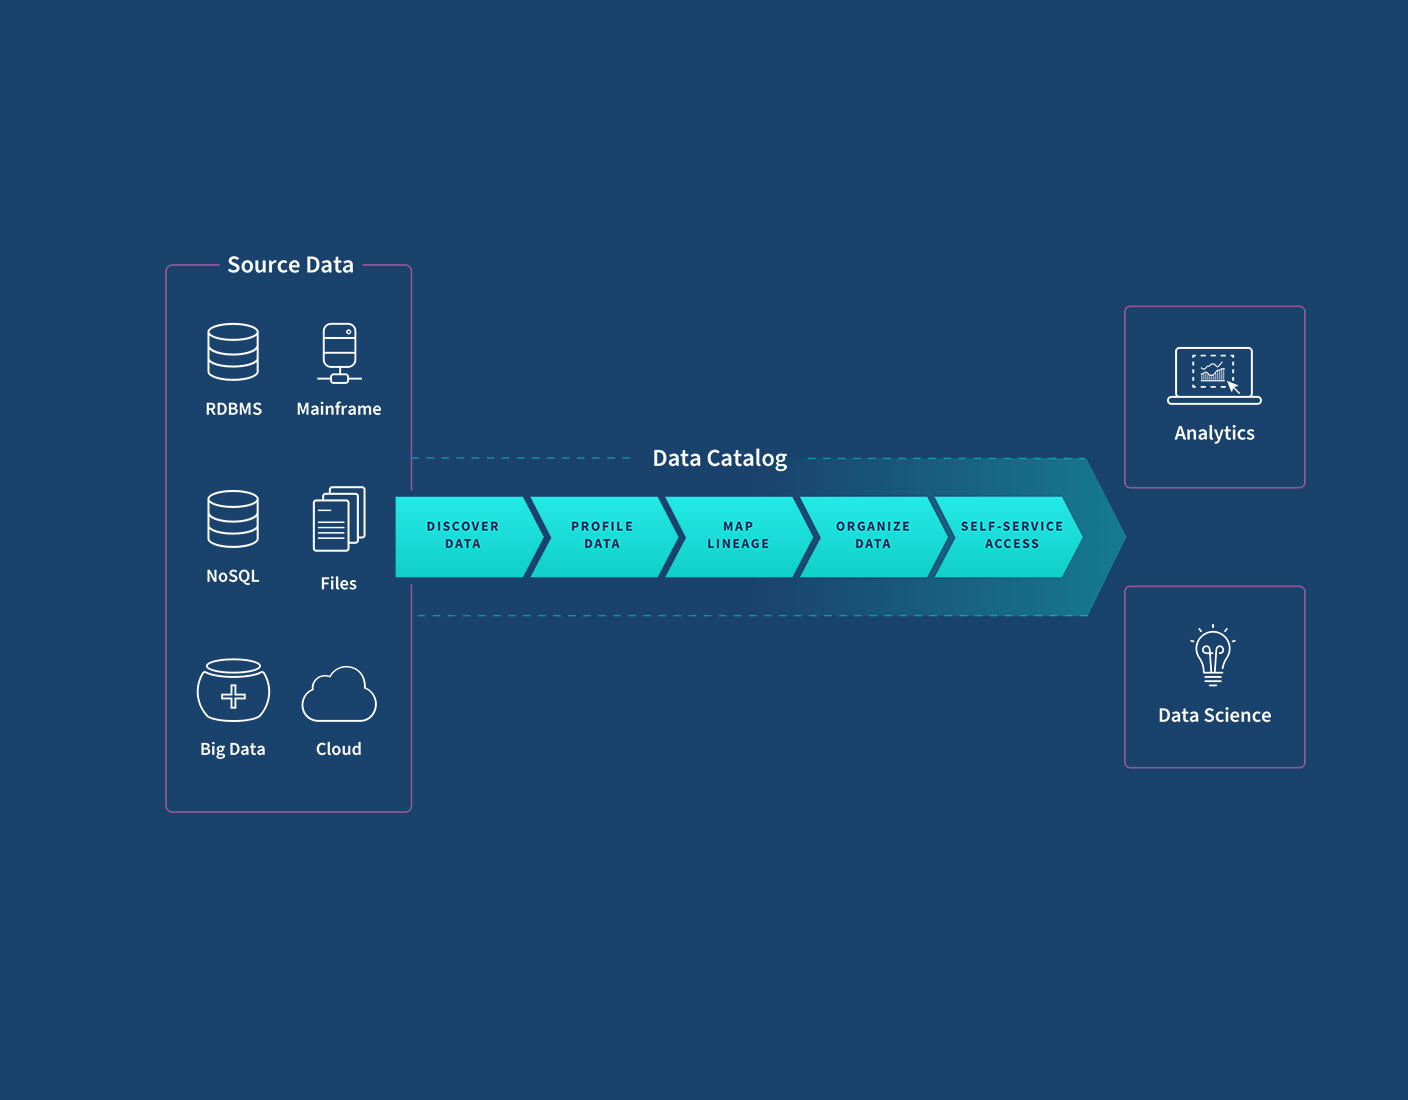
1. Data catalogs in one sentence
A data catalog is a centralized index of your organization’s analytical assets, tables, views,
dashboards, files, enriched with information that explains what they are, where they come from, how
they’re used, and whether they can be trusted.
Instead of asking “who knows where this metric lives?” you search the catalog, see the relevant
tables and reports, and get the context you need to decide if that data is fit for your purpose.
2. Why data catalogs matter now
As data stacks moved to the cloud, two things happened at once:
• Collecting data became easier. With one click you can connect SaaS tools, event
streams, and databases into your warehouse.
• Understanding data became harder. The number of tables and dashboards exploded,
and it’s no longer obvious which version of a metric is “the” version.
Without a catalog, analysts and engineers spend huge amounts of time:
• Hunting for the right table among dozens of near-duplicates
• Reverse-engineering dashboards to guess how a metric is defined
• Re-creating datasets that already exist because they’re easier to rebuild than to discover
A catalog breaks this pattern by turning your data warehouse into a navigable system rather
than a black box of tables and columns.
3. Metadata: the language of the catalog
At the heart of every data catalog is metadata, the descriptive information that
tells you what a dataset is, how it’s structured, where it comes from, and how it behaves.
If a dataset is the “thing,” metadata is everything you know and write down about that thing.
3.1 Everyday example
Think of a song in a streaming app:
• The audio file is the data.
• The title, artist, album, genre, and release date are descriptive metadata.
• The file format, bitrate, and duration are technical metadata.
• Play counts and likes are usage metadata.
• Whether it’s explicit, region-restricted, or licensed is governance metadata.
Data catalogs do something similar for warehouse tables, reports, and other assets, but at enterprise
scale.
4. Key types of metadata in a catalog
Modern catalogs typically bring together several categories of metadata so users get a complete
picture.
Descriptive
• Human-readable name and description
• Business definitions and metric formulas
• Tags, domains, and subject areas
• Owners, stewards, and subject-matter experts
Technical
• Database, schema, table, and column structure
• Data types, constraints, and primary keys
• Connection details and storage locations
Operational
• Refresh frequency and last load time
• Query performance and access patterns
• Popularity (top queries, top dashboards using the asset)
Risk and governance
• Sensitivity labels (PII, finance, health, etc.)
• Data retention rules and access policies
• Data quality signals and lineage to upstream sources
How Dataoma helps: Dataoma connects directly to your data warehouse, profiles
tables automatically, and turns the results into rich metadata: column distributions, null rates,
uniqueness, and more. That profiling becomes part of the catalog, giving users an immediate feel for
data quality without writing a single query.
5. What a data catalog actually does
Different vendors use different language, but most modern catalogs cover a similar set of
capabilities.
5.1 Unified inventory of data assets
• Automatically scans warehouses, lakes, and BI tools to list available datasets and reports.
• Keeps that inventory up to date as new assets appear or old ones are retired.
5.2 Search and discovery
• Lets users search by name, keyword, column, tag, or business concept.
• Ranks results by relevance, usage, endorsements, and other signals.
5.3 Context and documentation
• Surfaces definitions, example queries, and usage notes for each asset.
• Captures Q&A and discussions so hard-won knowledge isn’t lost in chat history.
5.4 Lineage and impact analysis
• Shows how data flows from source systems through pipelines into downstream tables and dashboards.
• Helps engineers understand what will break if they change or deprecate a field.
5.5 Data quality signals
• Displays freshness, volume, and quality metrics so users can quickly gauge reliability.
• Surfaces warnings when tests fail or anomalies appear.
Where Dataoma is different: Dataoma doesn’t just display documentation and
quality metrics, it derives them from your warehouse. It generates documentation from real
usage and profiling, then turns that knowledge into automated tests (e.g., “this column is usually
unique”, “this value range is typical”) so your definitions and checks stay in sync.
6. How a catalog changes day-to-day work
To see the impact of a catalog, it’s useful to compare how analysis looks before and after one is in
place.
Without a catalog
• Analysts ping teammates and dig through old dashboards to guess which table to use.
• Multiple teams produce “similar but different” versions of the same KPI.
• New hires depend heavily on tribal knowledge and undocumented SQL.
With a catalog
• Analysts search for a concept (e.g., “active users”), see the canonical table and metric
definition, and start from there.
• Shared documentation and tests establish one trusted version of key metrics.
• Onboarding time drops because curated datasets and their context are easy to find.
Many teams report flipping the classic “80/20 problem”: instead of spending 80% of their time
looking for and cleaning data, they spend most of their time actually analyzing and building on
data they trust.
7. How Dataoma fits into the picture
Data catalogs traditionally focused on describing assets. Dataoma extends this idea by treating your
warehouse as the source of truth, then layering on:
Warehouse-native discovery
• Direct, read-only connections to platforms like Snowflake, BigQuery, Redshift, and others.
• Automatic scanning of schemas, tables, and columns, no manual spreadsheet uploads.
Profiling-driven understanding
• Column-level statistics (nulls, distinct counts, distributions) computed directly in the warehouse.
• Intelligent summaries that describe how a dataset behaves in practice, not just in theory.
Automatic documentation
• Generated descriptions and examples based on usage and profiling, which you can refine and extend.
• Centralized documentation that stays close to the data it describes.
Documentation-powered data quality tests
• Inferred expectations (e.g., uniqueness, acceptable ranges, allowed categories) turned into
executable tests.
• Continuous checks that run against your warehouse, alerting you when reality diverges from what’s
documented.
In short: Dataoma behaves like a warehouse-native data catalog plus documentation
engine plus testing framework. Instead of three separate tools, you get one integrated layer that
helps teams discover data, formalize knowledge, and keep that knowledge enforced by automated
checks.
8. Getting value from a catalog: adoption tips
Buying or building a catalog is the easy part. Making it part of everyday work takes some deliberate
effort.
8.1 Start with real use cases
• Seed the catalog with the datasets people already care about: core metrics, key dashboards,
heavily used tables.
• Document those first and encourage teams to use the catalog as the “front door” to them.
8.2 Make ownership explicit
• Assign clear owners or stewards for important datasets so questions don’t disappear into the void.
• Reflect that ownership inside the catalog so anyone can see who to contact.
8.3 Integrate into daily workflows
• Link catalog entries from dashboards, pull requests, and runbooks.
• Encourage people to update documentation and tags when they ship new models or tables.
8.4 Measure and share wins
• Track reductions in duplicated tables, broken dashboards, or time-to-answer common questions.
• Share stories where the catalog or Dataoma’s tests caught an issue before it hit stakeholders.
9. What changes when you rely on a catalog + Dataoma
When a data catalog is tightly integrated with your warehouse and backed by profiling and tests, the
data culture starts to shift:
• Analysts begin their work in the catalog or Dataoma, not in a blank SQL editor.
• Engineers can safely refactor models because they see lineage and downstream impact.
• Product and business teams gain confidence in metrics because they see how they’re defined, tested,
and monitored.
• Data leaders get a clearer view of which datasets matter, how they’re used, and where risks are.
Instead of fighting about whose dashboard is “right,” teams can have higher-level conversations
about experiments, strategies, and outcomes, because the underlying data layer is documented,
discoverable, and guarded by continuous checks.
Conclusion
Data catalogs have evolved from static lists of tables into active, intelligent layers that sit on
top of your warehouse. They give people a way to navigate complex ecosystems, understand what data
means, and decide whether to rely on it.
When that catalog is tightly integrated with your data platform, automatically profiles datasets, and
turns documentation into living tests, as Dataoma does, you move beyond “knowing what you have” to
proving that what you have is trustworthy.
If you’re serious about making your organization truly data-driven, investing in this metadata and
documentation layer is no longer optional. It’s the foundation that makes the rest of your data
stack work.
Connect Dataoma to your warehouse in minutes →